
Monitoring and Alerting for OpenStack
Thursday, October 17, 2013
OpenStack is a loosely coupled distributed system. Given the number of moving parts in OpenStack, the particular configuration of an OpenStack deployment, and the underlying layers in the data plane, failure detection and debugging can get non-trivial. In particular, some components like DHCP agents, Quantum/Neutron APIs, their drivers, Nova metadata API, volume backend devices, Swift etc. have higher availability bar due to their involvement in certain flows in the cloud data plane. OpenStack deployments need significant investments in log aggregation, metrics collection, monitoring and alerting for early problem detection and recovery. In this post, I would like to show some of the practices and open source tools that you can use for problem detection and trouble shooting.
To set the context, take a common task like creating a new virtual machine instance. The diagram below shows all the components that must cooperate to bring up the virtual machine into a state that a tenant is able to use. The flow starts from a tenant request for a new virtual machine and ends with the successful completion of the cloud-init process. Boxes with thin borders show the control plane, while boxes with bold borders show components that participate during the boot process and later. In this example, quantum is backed by the NVP plugin, and keystone is set to use PKI for tokens. I’ve ignored the database in this diagram.
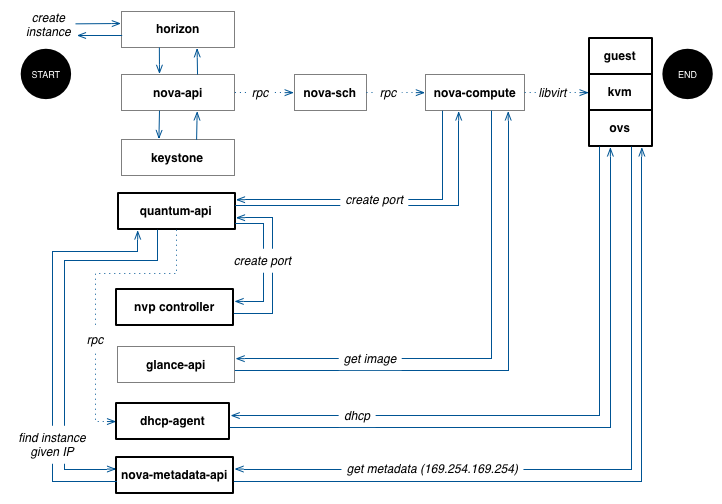
The best possible outcome for the requesting tenant is a virtual machine ready to use in a couple of minutes or less. Other possible outcomes include performance degradation of APIs like nova, glance, or keystone, or nova scheduler failures due to hypervisor or network capacity, timeouts due to performance degradation of any request along the flow, or partial failures such as a virtual machine that could not get its network interfaces up or a virtual machine that the tenant can not access due to metadata API failures.
In this flow, a 202 response code from nova API or even a virtual machine with the power state ACTIVE does not actually mean that the tenant got what it asked for. This is true for several other common flows as well.
Fortunately, most of the OpenStack components generate raw signals to debug failures. But it is up to the operator to build a system to collect those raw signals, and process them into metrics to monitor and alert upon.
Below is a diagram that shows common signals and a schematic of how to collect, process and generate useful metrics and events for tracking and monitoring.
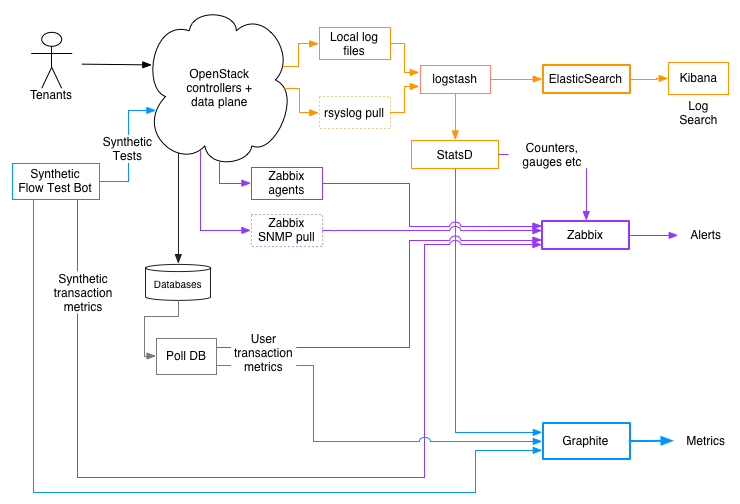
The key signals to look for include the following:
Basics: These include usual signals like process health, restarts, CPU, memory etc across all nodes. In the diagram above, this is done via Zabbix, an open source solution for monitoring and alerting.
Log files: This is one of first sources to look at for most problem resolutions. In addition to detailed trace of warnings and errors, log files in OpenStack include useful information to know how various OpenStack APIs are behaving. For instance, here is a message from the nova-api log.
2013-10-13 18:56:11 INFO nova.osapi_compute.wsgi.server [req-69b8fce4-b18c-4a52-8c6f-4256d4e45db2 991a8f5572cdeb7fb04a91aca1c4cb7b 991a8f5572ca4b7fb04a91aca1c4cb7b] xx.xx.xx.xx,xx.xx.xx.xx - - [13/Oct/2013 18:56:11] “POST /v2/991a8f5572cdeb7fb04a91aca1c4cb7b/servers/c4ba5bba-228d-4997-b077-92507238c37a/action HTTP/1.1” 202 121 0.109871
This message tells you many things:
- The component label nova.osapi_compute.wsgi.server tells that this message is due to an API request with a request ID, project ID and user ID. By aggregating all log files into a central store that can index those and provide a search interface, you can determine which of the components and hosts that the request went through and the outcome at each stage.
- This message also tells that it was a POST request to create a virtual machine instance, the response code was 202, client IP addresses (masked in this example) and that it took 0.109871 seconds. By extracting these bits of data, you can trend traffic, failures, and response latencies over time, and use those metrics for KPI tracking as well as generating alerts when those metrics deviate from the guarantees you provide as a cloud operator.
Having used logstash, ElasticSearch, and Kibana for nearly a year in production in our cloud at eBay, I would not run an OpenStack cloud without this trio for log collection and processing. logstash is quite flexible for log collection and processing. For OpenStack deployments, logstash is particularly useful since not all components follow the same format for log messages. logstash’s grok filter helps normalize various log messages into a format that can be indexed and searched.
Once collected and parsed, you can send logs to ElasticSearch for indexing using the ElasticSearch output. With Kibana, which is now an ElasticSearch plugin, as a front-end to ElasticSearch, you can search logs in near realtime. Input/output plugins like zeromq help transport logs from their source to an ElasticSearch cluster.
Log searching is useful for debugging, but how to mine health indicators like request rates, error rates, latencies etc? This is where Etsy’s statsd comes in. By funneling parsed logs into statsd via logstash’s statsd plugin, you can extract timing metrics, counters and rates from logs. Once extracted, you can send them to a system like Graphite for metrics tracking and graphing, and a system like Zabbix for alerting.
Database tables: OpenStack database tables have a ton of useful data that an operator must look at periodically. In addition to showing usage growth and impending capacity issues, tables like nova.instance_faults and nova.instances tables include some key performance indicators. For instance, nova.instance_faults table keeps track of scheduling failures, which is an important indicator of system health. Similarly, instances with non-NULL task_state in the nova.instances table beyond a reasonable time after a task show potential health issues.
How to extract this information for monitoring and alerting? All it takes is some code to periodically poll those tables, count various indicators, and then write to systems like Graphite and Zabbix.
Synthetic Flows: What we found during a year+ of operating an OpenStack private cloud at work is that the above are not sufficient to help us proactively find issues before our users see them, and to reduce time to recovery. Here is why.
- The signals above do not reflect all potential failures. For instance, none of the above sources may reveal that, though the virtual machine creation succeeded, the tenant was unable to use the instance due to a failure during cloud-init. Such a failure may have happened due to a failure in the DHCP agent, metadata API, Quantum or even just a slow database query.
- Some failures may be due to bad user input such as a broken user-data script, or a bad image. Though we can filter out some bad user inputs for all API requests by ignoring responses with 4xx response codes, bad user inputs that get used during the boot process are hard to filter out.
- Finally, no errors in logs, database tables, or other sources may not mean that all components are functioning as expected. It may just be due to no user exercising certain critical components of the cloud at the moment.
One way to account for these blind spots is to select a few key flows like the ones below that count towards the operator’s SLA, and synthesize those flows with controlled inputs such that you can programmatically assert the outcomes against expected.
- Launch a virtual machine instance and verify that it is usable by the tenant.
- Delete an instance and see that the instance is gone and tenant’s quota is back.
- Attach a volume and write to it.
- Take instance and volume snapshots.
- Publish a new image, and repeat (1) with that instance.
Any deviations show health issues. In the schematic above, there is a synthetic test bot that is continually exercising the cloud and writing signals to Graphite and Zabbix.
There it is. Since OpenStack is not a closed system, you can use open-source tools like logstash, ElasticSearch, StatsD, Graphite, Zabbix etc to tame OpenStack into an operable cloud. Remember, OpenStack is not cloud.